April 11th, 2025
When I started eighth grade, my cousin gave me their TI-84 graphing calculator. I had never had a graphing calculator before and was confused as to why the screen was so big! All my calculators before only had one line to display the current working number, what could all this extra space be used for? Well, it’s in the name: graphing calculator. In addition, my Algebra 2 teacher taught us to write a program on our TI-84 to solve the quadratic equation. After learning I could write programs on my calculator, I went home and learned everything I could about the TI-84’s programming language, TI-Basic.
I was amazed at the programming capabilities of this tiny computer that could fit in my pocket (I did not have a smartphone or a laptop at the time). Even after getting a laptop and learning to program in Python and Java, I continued to write programs on my TI-84. It continues to be a useful tool for rapid development and execution of small programs while doing homework or automating tedious calculations.
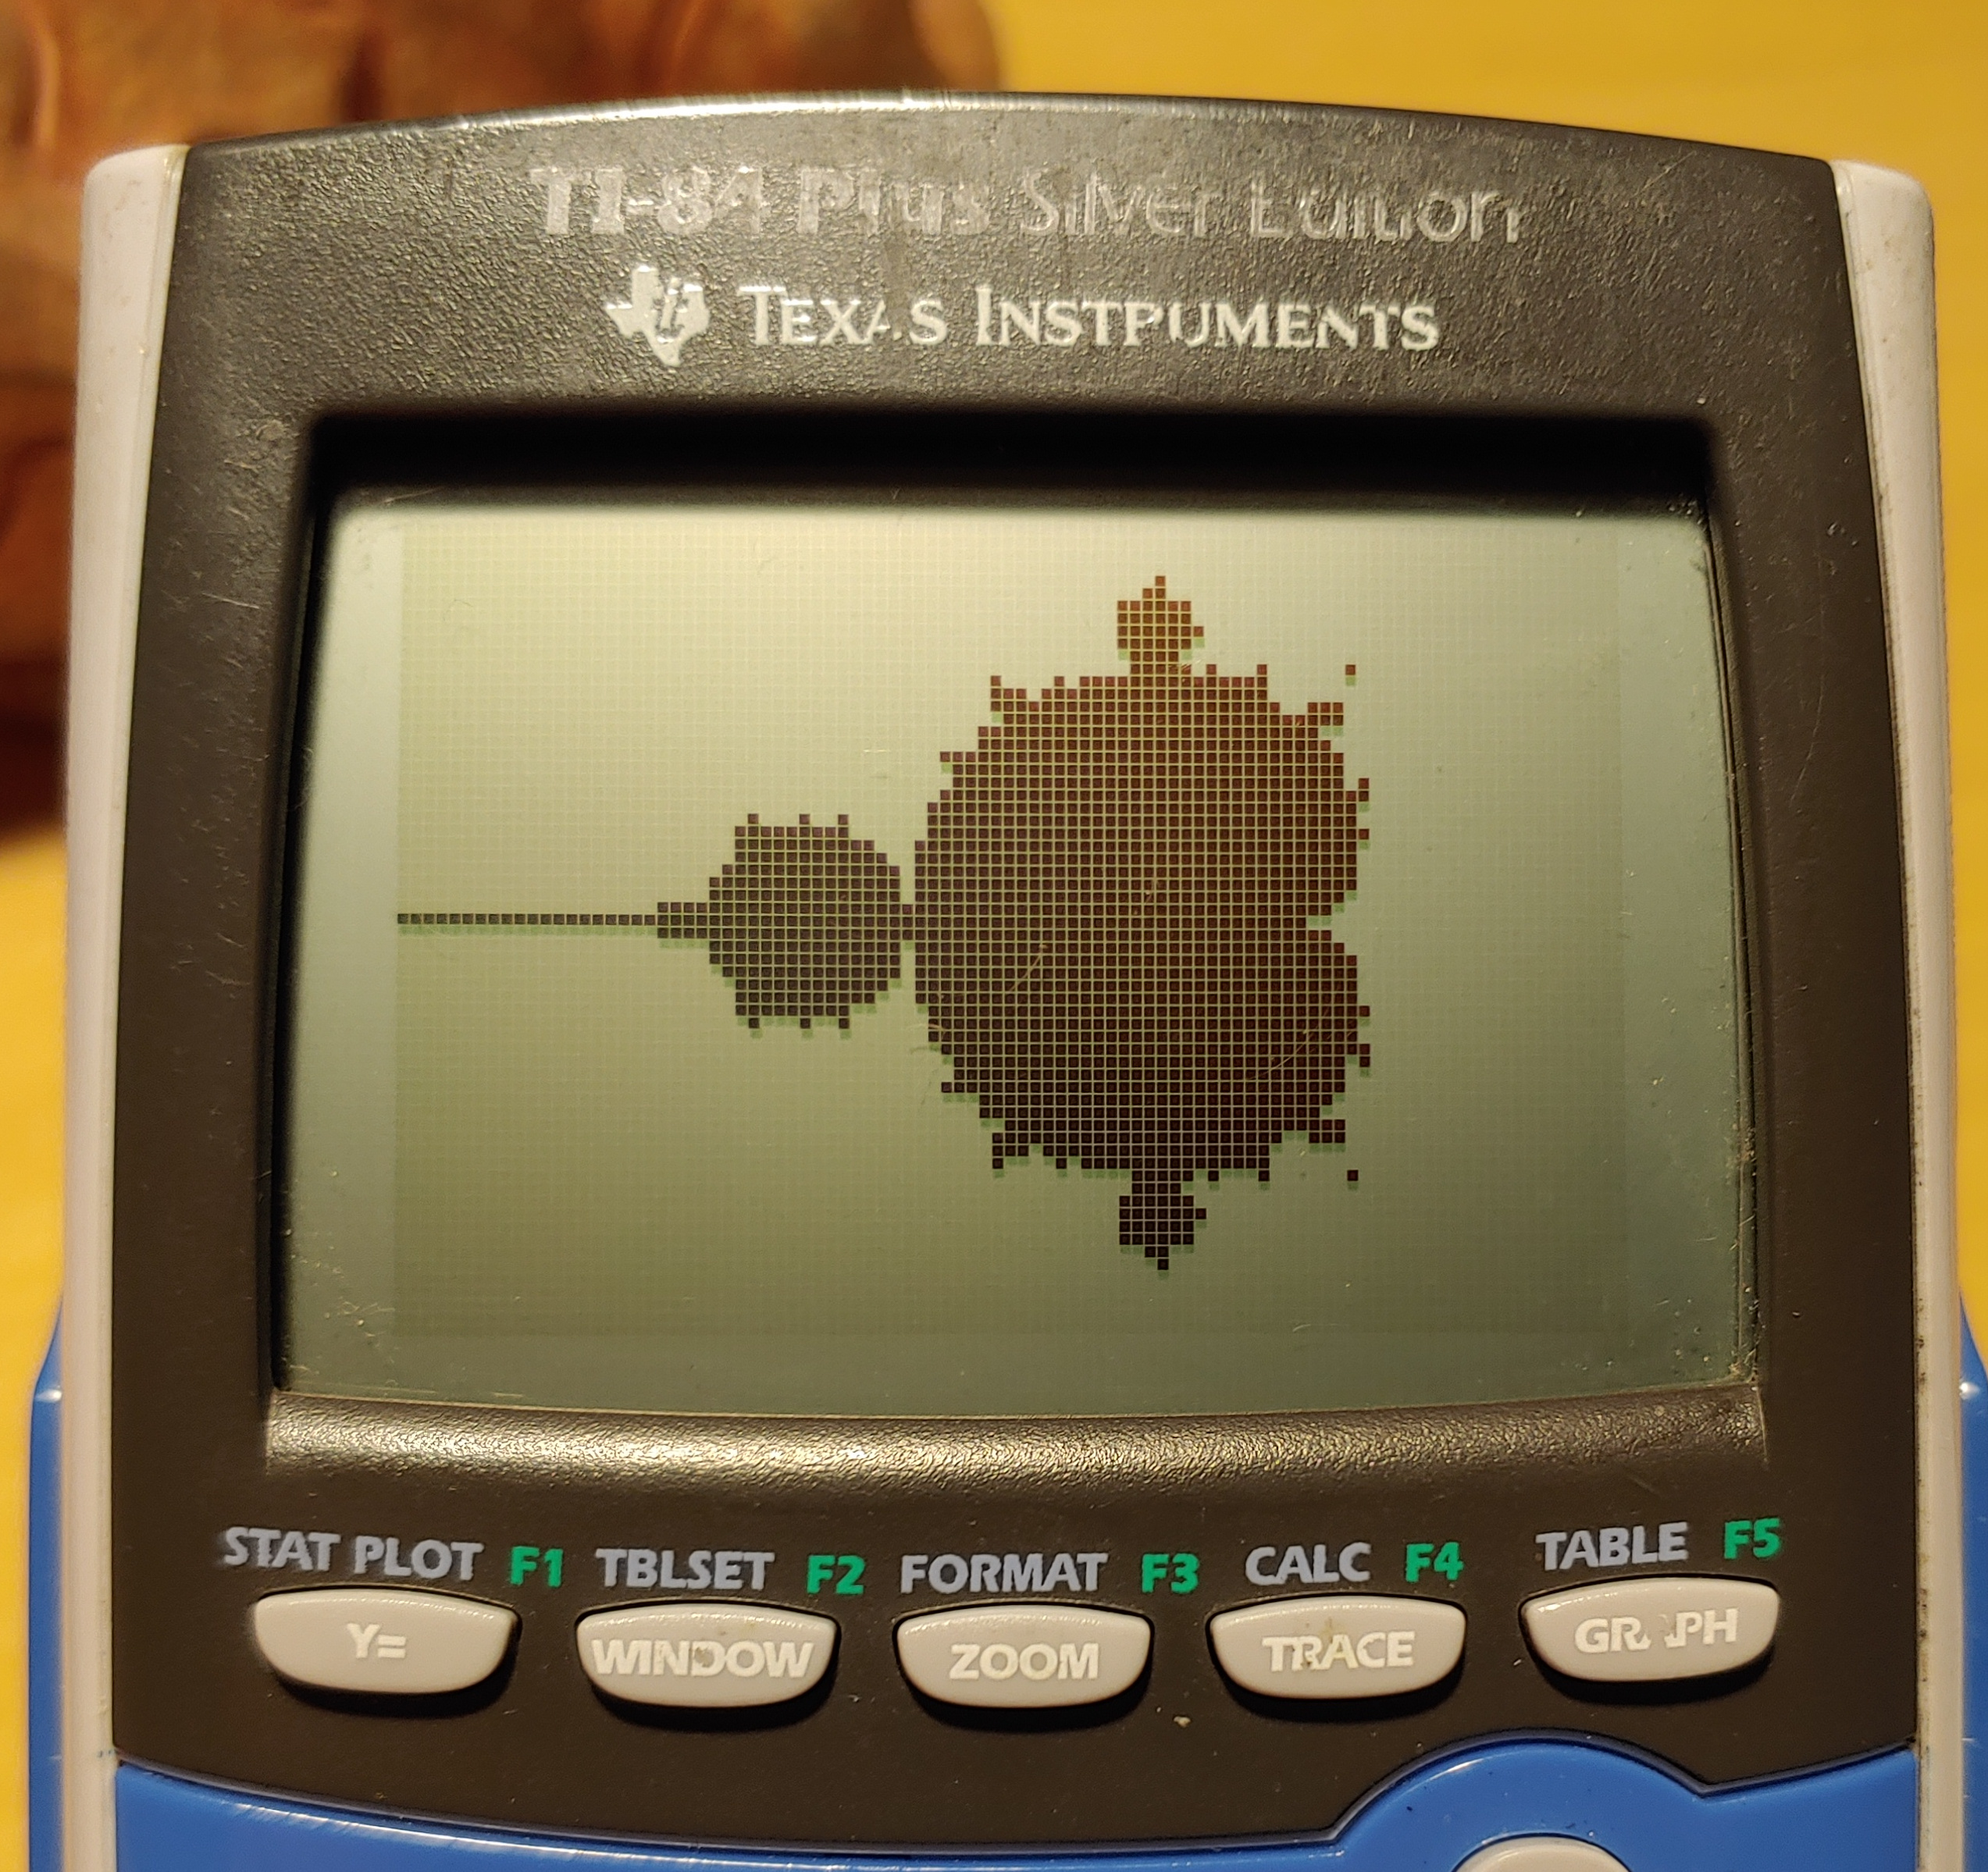
Being an avid collector of calculators, I love exploring what other people have been able to accomplish with their pocket-sized computers. I recently came across a Pintrest post of a Casio fx-7000GB which had an image plotted on its screen. The specific image was a fractal called the Mandelbrot Set, one that I had seen before but was not too knowledgeable about. Here began my quest: I would write a program to render the Mandelbrot Set on my own trusty TI-84!
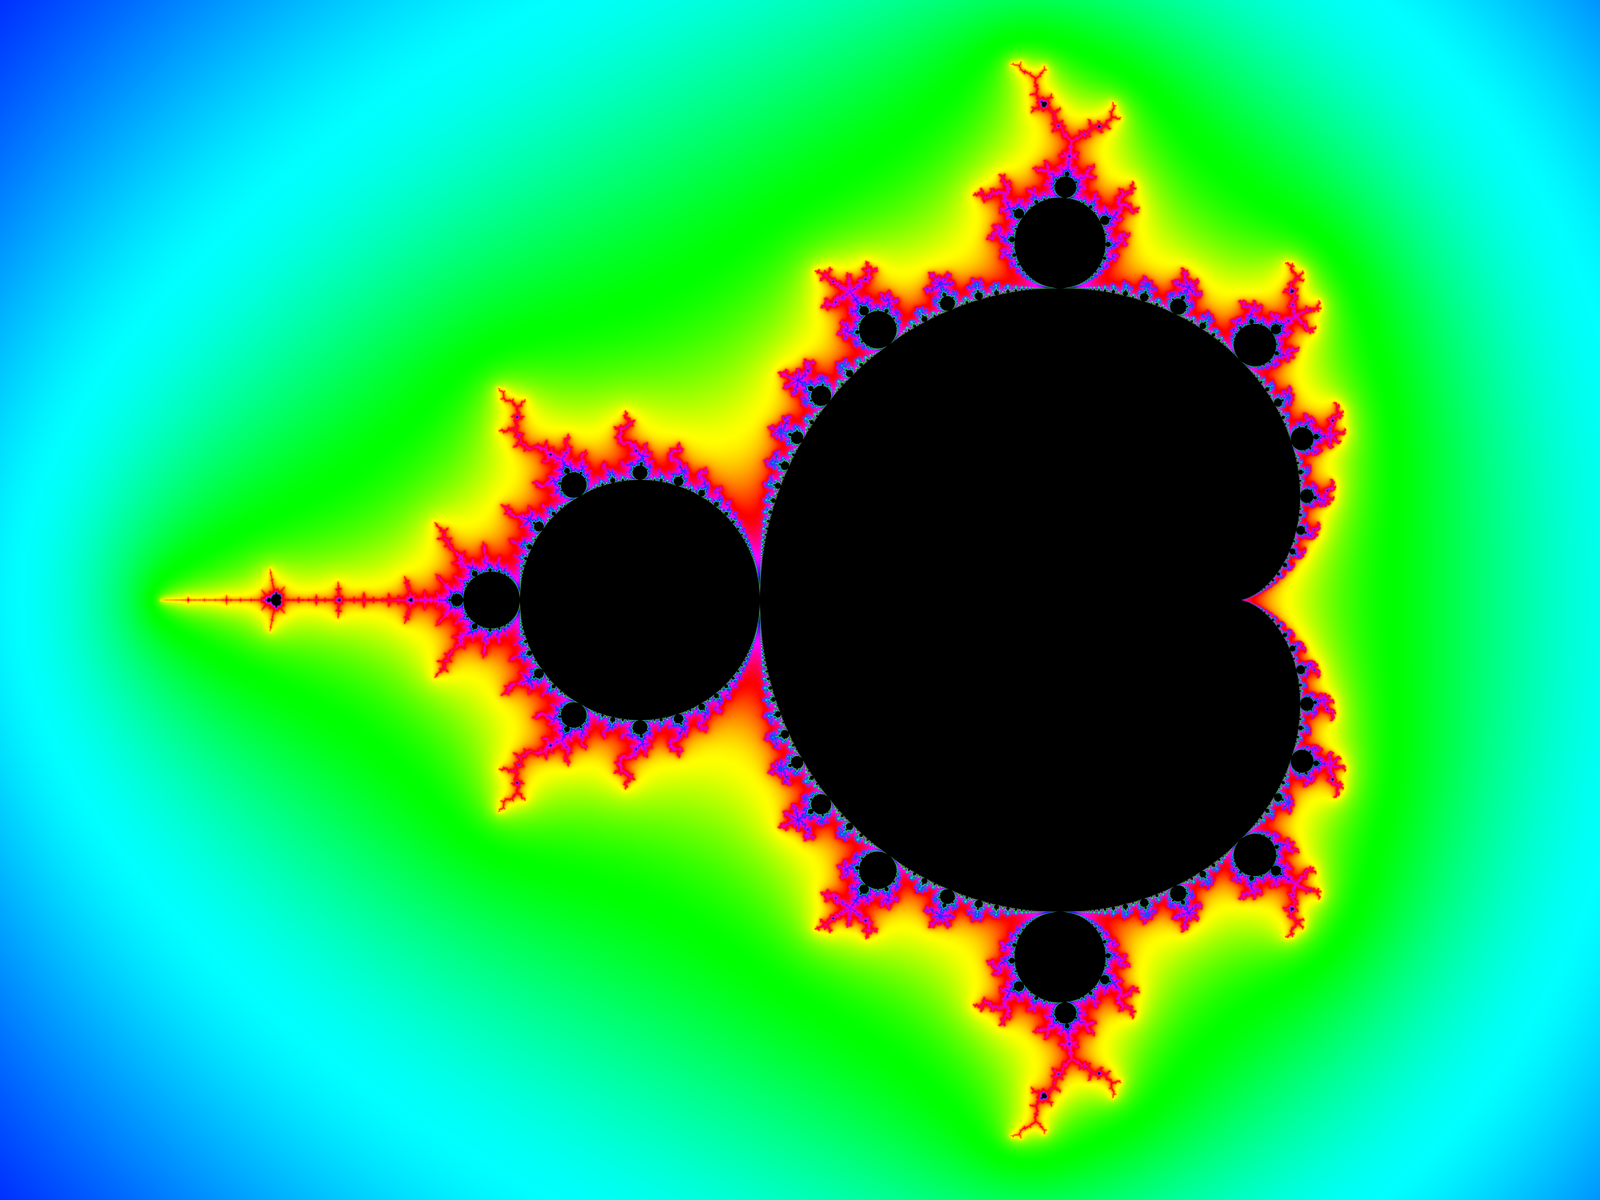
The Mandelbrot set is a two-dimensional fractal that exists within the complex plane. Despite having an infinitely large perimeter it has a finite area. It was first defined and discovered by mathematicians Robert W. Brooks and Peter Matelski in 1978, and later named after Benoit Mandelbrot for his research into fractal geometries.
A fractal is a geometric construction that is infinitely complex and self repeating. Often obtained through a recursive process, fractals are impossible to draw exactly due to their infinitely fine details. However, this does not stop people from trying to create ultra-high-resolution images zooming into the Mandelbrot set's psychedelic and infinitely complex boundary. Despite being impossible to draw exactly, the Mandelbrot set has a discrete mathematical definition. But to understand that we must first understand convergence and complex numbers.
Functions generally display two behaviors as they are evaluated at bigger and bigger numbers, they can either converge or diverge. We say a function converges towards infinity if the value of the function approaches a single value as the input variable increases towards infinity. We also say a function diverges if it does not approach such a value.
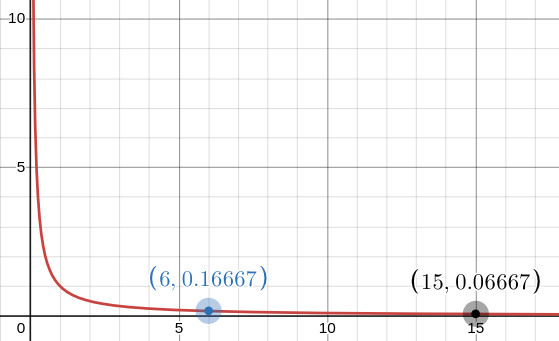
Lets examine the function \(f(x) = 1/x\). As the value of \(x\) increases, the fraction \(1/x\) continues to get smaller and smaller. Since for large positive values of \(x\), \(1/x\) will never be negative, the function will never pass below zero on the y-axis. Thus we say the function \(f(x) = 1/x\) converges to zero as \(x\) approaches infinity. Looking at its graph, we can see that \(f(x)\) continues to decrease forever getting closer and closer to the x-axis without actually crossing over it.
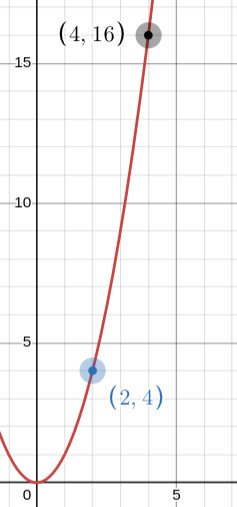
Now lets look at \(g(x)=x^2\). As \(x\) increases, so does \(x^2\). Instead of converging to a single value, it never stops increasing! Looking at its graph, we can see that the curve continues to increase up towards infinity with no end in sight. Therefore we say the function \(g(x)=x^2\) diverges as \(x\) approaches infinity.
Complex numbers arise from the square roots of negative numbers. We say \(\sqrt{1}=\pm 1\) since \((1)^2 = (-1)^2 = 1\). But what is the square root of -1? This question can't be answered with any of the real numbers. The real numbers are all of the numbers, fractions, and decimals we are familiar with from negative infinity towards infinity. So mathematicians invented the complex numbers, written in the form \(a+bi\) where \(a\) and \(b\) are both real numbers and \(\pm i=\sqrt{-1}\), which René Descartes infamously called an imaginary number.
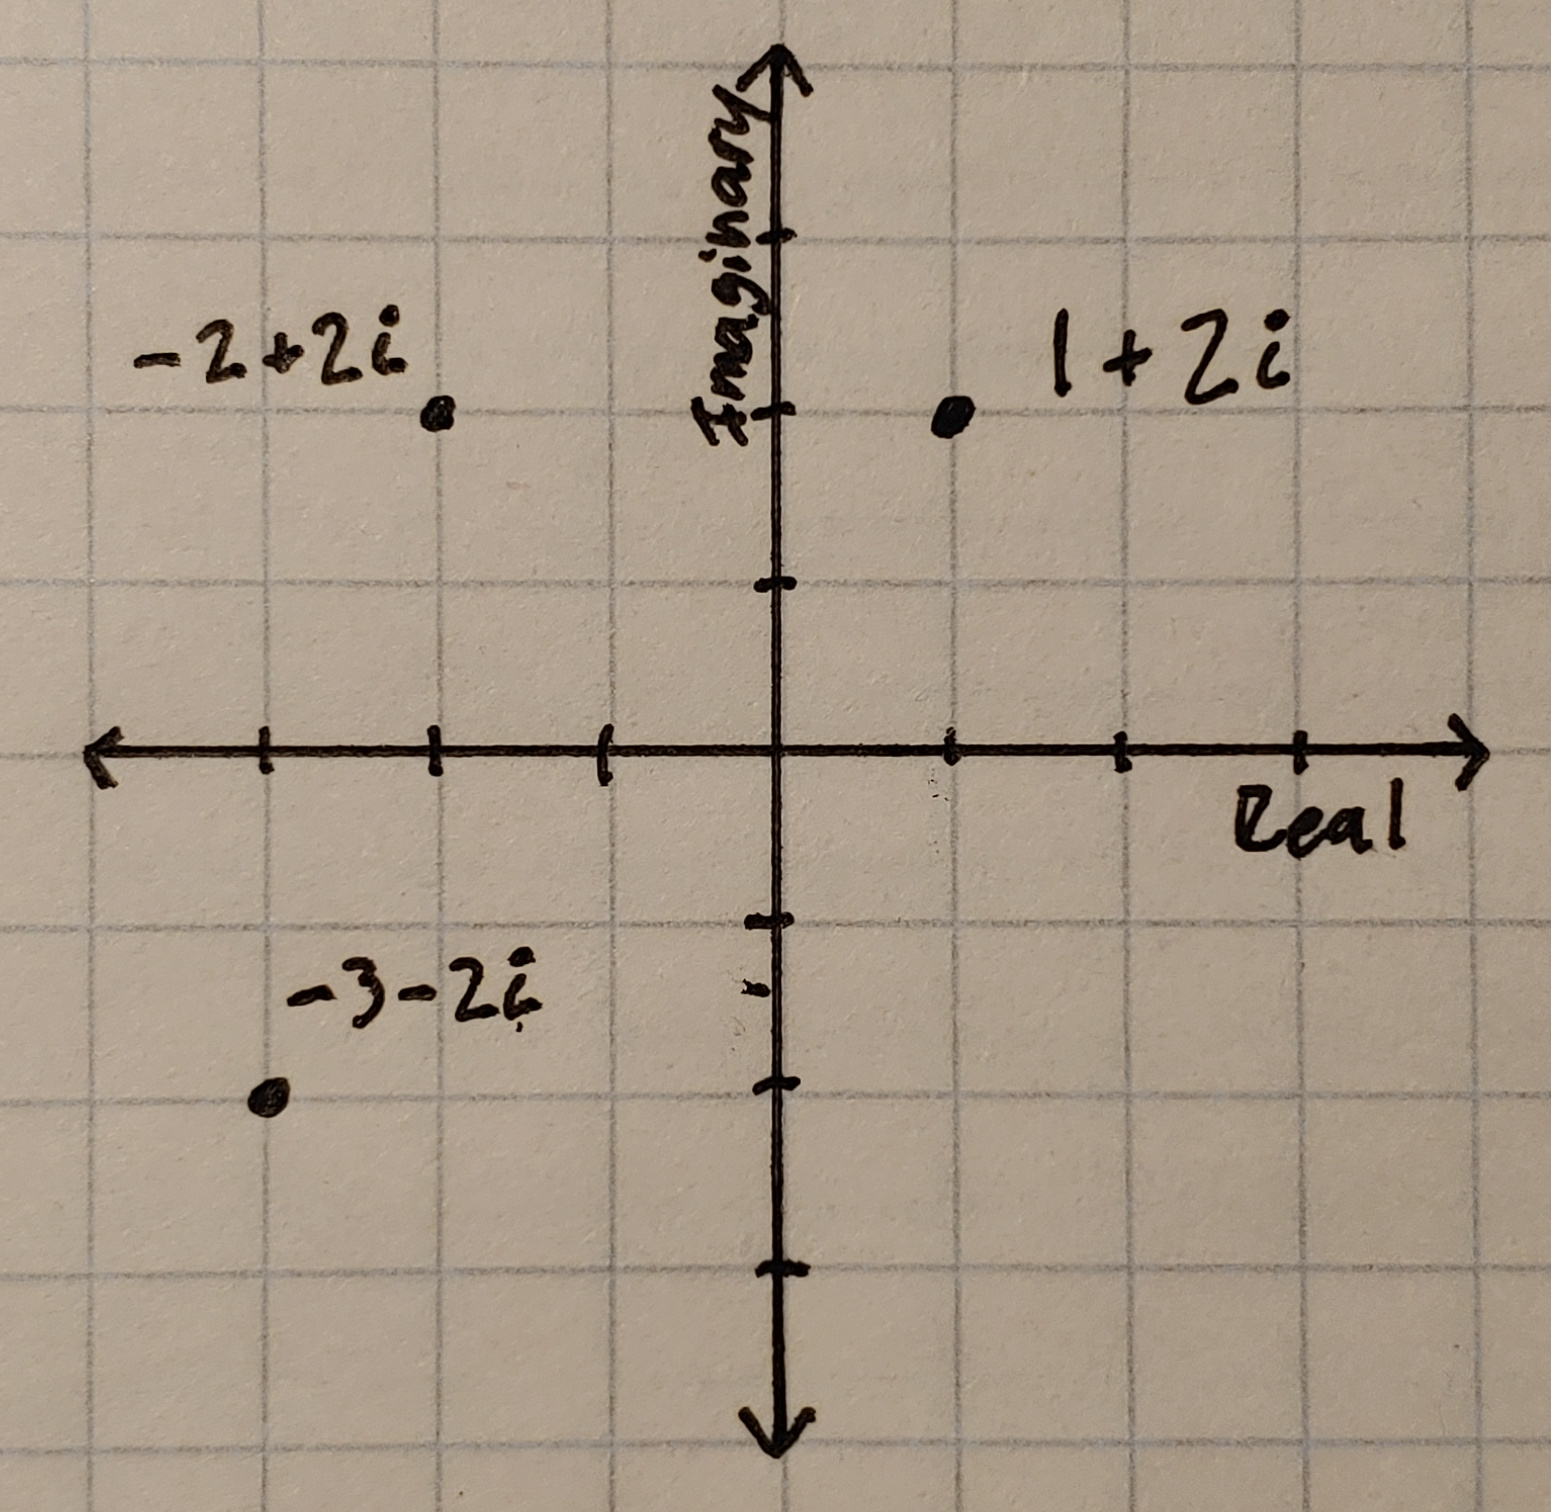
Complex numbers can be visualized as an extension of the real number line in the form of a Cartesian plane. Using the \(a+bi\) notation, the value of \(a\) can be expressed on the x-axis which represents the real number line, and the value \(bi\) can be expressed on the vertical y-axis to represent the imaginary number line.
The Mandelbrot set is mathematically defined as the set of all complex numbers \(c\) that do not cause the function \(f(z)=z^2+c\) to diverge to infinity when iterated from \(z=0\).
Let's try to see if the imaginary number \(i\) is a part of the Mandelbrot set by calculating the first couple iterations of \(f(z)\): \begin{align*} f(0) = (0)^2+i&=i \\ f(i)=(i)^2+i&=(-1+i)\\ f(-1+i)=(-1+i)^2 +i&=-i\\ f(-i)=(-i)^2+i&=(-1+i). \end{align*}
As we can see, the series of the function's outputs oscillate between \(i\) and \((1+i)\) instead of diverging towards infinity, which means \(i\) is a part of the Mandelbrot set.
Now lets use the initial value \(c=1+2i\): \begin{align*} f(0)=(0)^2+(1+2i)&=(1+2i)\\ f(1+2i)=(1+2i)^2+(1+2i)&=(-2+6i)\\ f(-2+6i)=(-2+6i)^2+(1+2i)&=(-31-22i)\\ f(-31-22i)=(-31-22i)^2+(1+2i)&=(478+1366i)\\ f(478+1366i)=(478+1366i)^2+(1+2i)&=(-1637471+1305898i). \end{align*} We can observe that with each iteration, our result keps increasing in magnitude, or distance from the origin \(0+0i\). In fact it has been shown that if the magnitude of any iteration is greater than 2, then the function will diverge. The magnitude of \(f(0)=1+2i\) can be evaluated using the distance formula, \[\sqrt{(1)^2+(2)^2}=\sqrt{5}>\sqrt{4}=2.\] From this result we can show that \(c=1+2i\) causes our function to diverge. Therefore \(c=1+2i\) is not a part of the Mandelbrot set.
If we had evaluated the magnitude of our first iteration and found that it did not belong to the Mandelbrot set, we would not have had to continue calculating further iterations of our function. We will use this idea in our program to save ourselves from making unnecessary calculations to try and reduce the program's runtime.
Writing a program to render the Mandelbrot set on a TI-84 graphing calculator comes with difficulties due to the limitations of both our hardware and the TI-Basic programming language. As such, we will only be implementing a rudimentary program that effectively draws the set pixel by pixel.
The method we will be using is called the escape time algorithm. For each pixel on screen we will translate it to a complex number \(c=a+bi\), and then calculate some iterations of the function to see if they have a magnitude greater than two and thus diverge. Because we only have a finite amount of time to do our calculations (we do want to produce a result after all), we will limit our program to a maximum number of iterations, known as a bailout or escape condition. This means if we reach the bailout point before the magnitude of our result exceeds two, we will assume the function does not diverge and that \(c\) is in the Mandelbrot set. The larger the escape condition, the more accurate our drawing of the set will be.
However, the TI-84 Plus Silver Edition I am using has a 0.4MHz processor, which is quite slow compared to today's smartphones that have processors up to a thousand times faster. Because of this we will limit the escape condition to be only one hundred iterations. Thankfully, the TI-84 Plus Silver Edition can only plot within a \(63 \times 95\) pixel area, totaling to just 5,985 pixels, meaning a maximum of 598,500 iterations.
Variables can only be named with a single letter rather than a descriptive camel-case name. It will be helpful to write out all of the variables we will be using as well as their purpose so that we do not get confused later on. Furthermore, we will generalize the program to work only with real numbers by translating the complex arithmetic to arithmetic with our real numbered variables.
| \(X = \) pixel x coordinate \((0 \leq X \leq 94)\) |
| \(Y = \) pixel y coordinate \((0 \leq Y \leq 62)\) |
| \(A = \) real component of \(c=a+bi\) |
| \(B = \) imaginary component of \(c=a+bi\) |
| \(P = \) real component of \(z=a+bi\) |
| \(Q = \) imaginary component of \(z=a+bi\) |
| \(I = \) iteration variable |
| \(S = \) secondary iteration variable |
| \(M = \) max iterations |
| \(T = \) temporary variable |
We will start our program by turning off the graph axes and clearing any drawings that might already be on the screen. Both of these commands can be found in the catalog. Then we can use two for loops to iterate through every pixel's coordinates. In TI-Basic, for loops are closed with an "end" point so we will need one for each loop, but we will keep room in-between them for the rest of our code.
Before we do any calculations we need to initialize out variables, including translating the pixel coordinates to the complex coordinates we want to test. The equations I used translate the TI-84 screen into the complex plane with the bounds \((-2 \leq a \leq 1)\) and \((-1 \leq b \leq 1)\), but you can use different equations if you want to render a different section of the complex plane. This makes our initial condition \(c=A+Bi\).
      AxesOff
      ClrDraw
      For(X,0,94)
      For(Y,0,62)
      3X/94-2→A
      1-Y/31→B
      0→P
      0→Q
      0→I
      0→S
      99→M

      End
      End
Next we can make a while loop to calculate iterations of the function using our initial condition. We want our while loop to run under two conditions: first that we remain below our escape condition, and second that the magnitude of our result remains below two. In a more modern programming language this would be accomplished by using both conditions conjoined by an "and" operation within the definition of our loop. Unfortunately TI-Basic does not allow multiple conditions to be defined within a while loop, but this is where our second iteration variable will become useful.
We will use the bailout condition in the definition of our while loop, ensuring that the number of iterations \(I\) does not exceed our escape condition \(M\). After every iteration we will increase both \(I\) and \(S\) by one, and we will also add an if statement to check the magnitude of our result. If the magnitude exceeds two, we can set \(I\) to be exactly equal to \(M\), ending our loop. This means we cannot check \(I\) later to see if we reached our bailout because it will be equal to the escape condition both if we stopped the loop because of excessive magnitude or by reaching the bailout point. However \(S\) preserves the number of iterations we performed, regardless of excessive magnitude, so we can use it later to determine how the loop was ended.
So now we can add our while loop, followed by our if statement for exceeding magnitude. After the if statement, we can calculate the next result using \(P\), \(Q\), and \(T\). Then we add one to both our iteration variables before ending the loop. While loops and if statements also need an "end" to be closed, so we will be careful to put them at the end of each command's respective operations.
      AxesOff
      ClrDraw
      For(X,0,94)
      For(Y,0,62)
      3X/94-2→A
      1-Y/31→B
      0→P
      0→Q
      0→I
      0→S
      99→M

      While I<M
      If P^2+Q^2<4
      Then
      M→I
      End
      P^2-Q^2+A→T
      2PQ+B→Q
      T→P
      I+1→I
      S+1→S
      End

      End
      End
Lastly, we will analyze \(S\) to determine how the while loop ended. If \(S=M\), then our loop ended because we reached our escape condition. This means that \(f(z)\) likely does not diverge for \(c=A+Bi\) and we can plot its respective pixel as likely belonging to the Mandelbrot set. Otherwise, our loop ended due to the magnitude of a result exceeding two, and we should not plot a pixel. In this case, I displayed the pixel coordinates so we can track the programs progress. Either it fills in a pixel on the screen, or it displays the coordinates of a pixel that was tested and not shaded. And now our program is finished and ready to run! Be prepared to wait though, it took over two hours for the drawing to be completed.
      AxesOff
      ClrDraw
      For(X,0,94)
      For(Y,0,62)
      3X/94-2→A
      1-Y/31→B
      0→P
      0→Q
      0→I
      0→S
      99→M
      While I<M
      If P^2+Q^2<4
      Then
      M→I
      End
      P^2-Q^2+A→T
      2PQ+B→Q
      T→P
      I+1→I
      S+1→S
      End

      If S=M
      Then
      Pxl-On(Y,X)
      Else
      Disp {Y,X}

      End
      End
One could likely write a better program on a newer, faster calculator with a color screen, such as the TI-84 Plus CE, but I don't own one. Renderings in color often use the number of iterations performed for each number \(c\) to determine the color of that number's pixel. Often black is used to represent a number within the set and lighter colors are used for numbers that bailed out at certain thresholds.
But for now I'm just happy that I was able to produce such a beautifully raw rendering of such a complex and historic fractal on my very own trusty calculator. It may not be perfect, but I made it myself and it brings me joy. I hope that you also try to make your own fractals or calculator programs and experience the infinite joy of exploring mathematics.